Executive summary
Visual/diagrammatic items became central to intelligence testing for a historical reason and then stayed for psychometric ones. Early test developers needed ways to assess people who differed in schooling, literacy, and language, and visual “performance” tasks were a practical workaround—most famously in group testing during World War I, where the U.S. military used a picture-heavy nonverbal exam (Army Beta) for recruits with limited English or literacy.
Once visual items existed at scale, measurement science gave them staying power. Well-designed visual puzzles (especially matrix reasoning) can be scored objectively, tuned across a wide difficulty range, and modeled with modern psychometric tools like item response theory (IRT), which lets test makers quantify item difficulty, discrimination, and measurement precision.
Cognitively, many visual IQ items are not “about eyesight”—they are compact ways to elicit relational reasoning, pattern abstraction, and working-memory/attention control under time pressure. Those are strongly implicated in fluid intelligence and map onto well-studied brain networks (notably fronto-parietal systems) that support goal management and reasoning.
Finally, there’s a pragmatic design logic: pictures travel across languages more easily than paragraphs, reduce translation burden, and scale efficiently for group or computerized administration. But “nonverbal” is not “culture-free,” and visual-heavy batteries have real limitations—practice effects, accessibility issues (e.g., visual impairment), and the risk of underrepresenting language-based abilities that matter in school and life.
How intelligence tests became visual
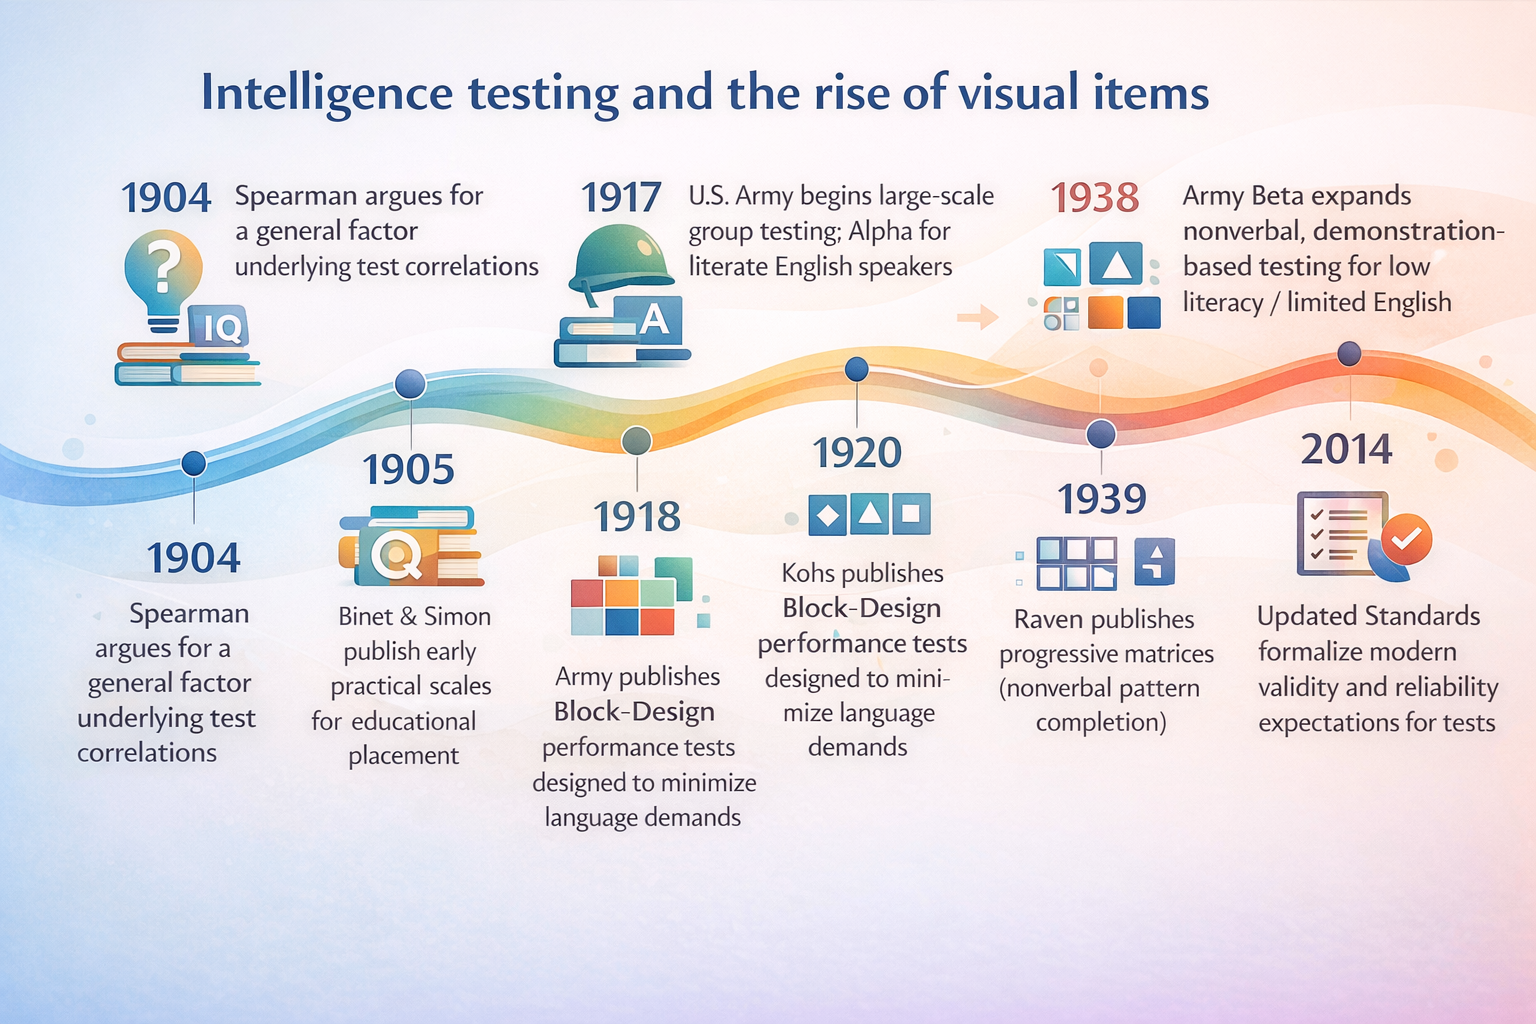
Modern intelligence testing grew out of a shift from measuring bodies (e.g., skull size) to measuring performance on tasks. A watershed moment was the work of Alfred Binet and Théodore Simon, whose early-1900s scales aimed to identify children who needed different educational support—using short tasks closer to classroom demands than to physical measurement.
In parallel, psychometrics was crystallizing a statistical idea that would later make “puzzle-like” items especially valuable: Charles Spearman argued that diverse cognitive tests tend to correlate because they share a common factor—later called g. This matters because many visual reasoning tasks (like matrices) were eventually favored precisely because they tend to correlate strongly with broad cognitive performance in many settings.
The “visual turn” accelerated dramatically with mass testing in World War I. Under Robert M. Yerkes, the U.S. Army’s program separated literate English speakers into Army Alpha and routed others into Army Beta, a largely nonverbal exam taught and administered via demonstrations (pantomime) and simple visual response formats. The logic wasn’t subtle: if you can’t assume reading fluency, you can’t base measurement on paragraphs.
That institutional pressure (huge volumes, heterogeneous test-takers, limited time) permanently changed test architecture. Postwar, a major consolidation happened under David Wechsler, who helped normalize the idea that a serious intelligence battery should combine verbal and nonverbal/performance components (a design philosophy influenced by earlier military performance exams).
The rise of matrix reasoning in the mid-20th century pushed the public image of IQ even further toward diagrams. John C. Raven (with Lionel Penrose) developed a progressive matrices format: “complete the pattern” problems that are nonverbal, scalable in difficulty, and simple to administer. This format has become so iconic that, for many people, “IQ test” now means “spot the missing square.”
Why psychometrics favors visual items
Psychometricians don’t choose item formats because they look cool on posters (though… triangles do have undeniable charisma). They choose formats that produce stable, interpretable scores.
A helpful anchor is the definition of validity in Standards for Educational and Psychological Testing: validity is about whether evidence and theory support the interpretations of scores for a given use, not about the test having some magical “validity substance.” From the same Standards tradition, good measurement also tries to minimize construct-irrelevant variance (noise from unintended skills) and construct underrepresentation (missing key parts of the intended construct).
Visual/diagram items are attractive under these rules for several intertwined reasons.
Reliability and scoring precision
Many visual IQ items are multiple-choice or have tightly specified correct answers. That reduces scorer subjectivity—one of the common sources of measurement error emphasized in the Standards’ reliability/precision discussion. Even when tasks involve performance (e.g., block assembly), scoring rules can often be standardized with clear rubrics and time limits.
Item discrimination and calibration
“Item discrimination” means: does an item reliably separate higher-ability from lower-ability test-takers? IRT makes this concrete by estimating parameters like difficulty and discrimination and by summarizing how much information (precision) a test provides at different ability levels—via the “test information function.”
Matrix reasoning formats are particularly IRT-friendly because items can be systematically varied by rule complexity, number of elements, distractor design, and so on—allowing a designer to build a ladder of difficulty that still measures the same broad construct. Psychometric analyses of progressive matrices (including IRT-based work) show how these tests can be evaluated for model fit, guessing/carelessness, and item functioning.
Efficiency and short forms
A practical but psychometric point: visual nonverbal tests are often used as “background measures” in research because they are comparatively straightforward to administer. But even then, administration time matters; researchers have developed shortened matrices to predict full-test scores with high accuracy. This “you can shorten it and it still works reasonably well” property is easier when the item bank is homogeneous, objective, and scalable—features visual matrices often have.
Why matrices, specifically, got the starring role
Not all visual items are equally central. The cultural stereotype of IQ as “pattern puzzles” is closely tied to progressive matrices because they are nonverbal and strongly related to general cognitive ability estimates across many contexts.
What cognitive science and neuroscience say
Visual IQ items work not because humans are secretly cameras, but because many diagrammatic problems compress reasoning demands into a low-language wrapper.
Visual-spatial reasoning as a vehicle for abstraction
A classic theoretical account of progressive matrices argues that doing well involves building structured representations of the problem, inferring rules, maintaining subgoals, and integrating relations—processes that distinguish high from low scorers. In other words, the “visual” surface is often just the delivery system; the target is relational reasoning.
Working memory and executive attention
A large body of research connects general reasoning performance to working memory capacity and executive attention control (e.g., resisting distraction/interference and managing rules over short time windows). Visual matrix items are naturally suited to stress-test these functions because you must hold multiple relations in mind while checking candidate answers against them.
Pattern recognition versus rule induction
Many popular explanations say “IQ tests measure pattern recognition.” That’s partly true—but the more precise idea is rule induction under capacity limits: noticing patterns, testing hypotheses, and updating them as complexity increases. Empirical and theoretical work on matrices emphasizes the importance of strategies, attention allocation, and the increasing processing demands as item complexity rises.
Neural systems: fronto-parietal networks and reasoning
Neuroimaging reviews link individual differences in intelligence and reasoning performance to distributed networks (often described as fronto-parietal integration), aligning with the idea that fluid reasoning depends on coordination between regions supporting attention, working memory, and rule manipulation rather than on a single “IQ spot” in the brain. This doesn’t mean a matrices test is a brain scan in disguise—but it supports the claim that “abstract reasoning tasks” capture real biological variability in information processing systems.
Real-world test design constraints
Psychometrics and cognitive theory matter, but test design also lives in the real world: classrooms, clinics, hiring pipelines, and research labs.
Language neutrality and reduced translation burden
Visual items reduce dependence on reading level and vocabulary, making them appealing when test-takers differ in language background. Historically, this was explicit: Army Beta was created for recruits who were illiterate or insufficiently fluent in English, using nonverbal tasks taught by demonstration.
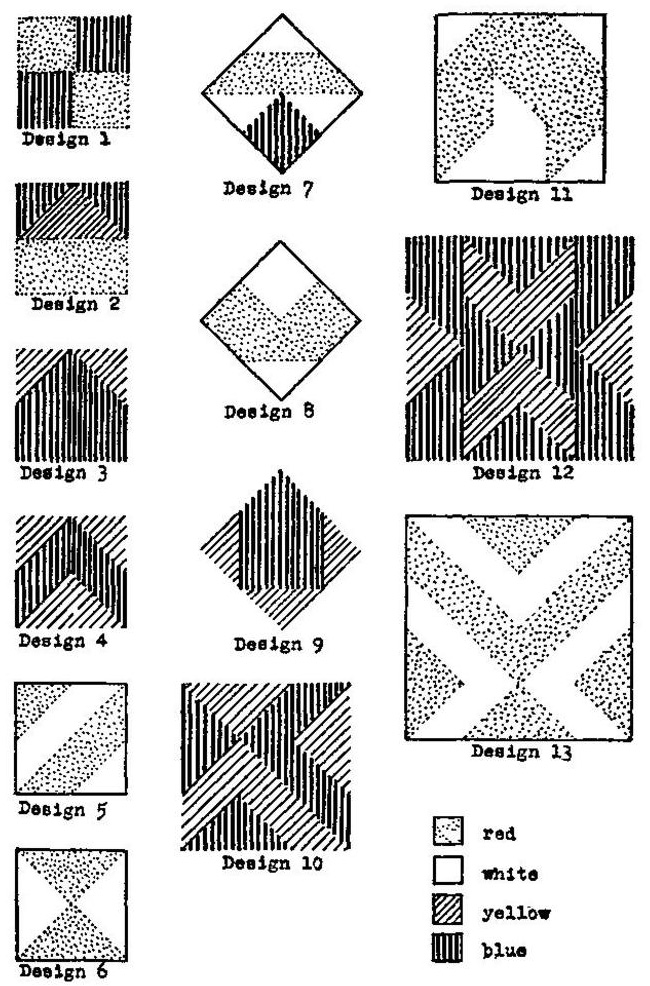
Similarly, early performance-test designers emphasized eliminating the “language factor.” In a 1920 block-design test paper, Samuel C. Kohs explicitly described the tests as devised to eliminate language, with instructions deliverable through pantomime and imitation.
Cultural fairness is an engineering problem, not a vibe
Visual does not automatically mean culturally fair. Even when language is minimized, groups may differ in exposure to test-like graphics, schooling practices, geometry conventions, or “what counts as a puzzle.” That is why cross-language/cross-culture adaptation is treated as a formal process, not a quick translation job, in International Test Commission guidelines.
Empirically, fairness is often studied using tools like differential item functioning (DIF): do specific items behave differently for different groups after controlling for overall ability? DIF analyses have been applied even to progressive matrices-type measures, illustrating that “nonverbal” tests still warrant scrutiny rather than blind trust.
Administration efficiency and scalability
Diagram items are easy to standardize for group settings: consistent prompts, limited writing, and rapid scoring (especially for multiple-choice formats). This is part of why matrices are widely used as “general ability” background measures in developmental research, even as researchers complain about the time burden of full-length versions.
Access and accommodations
A visual-heavy test can disadvantage people with visual impairments or certain motor limitations. The Standards explicitly note that accommodations (e.g., audio or large print versions) may change measurement properties and therefore require attention to reliability/precision under modified procedures.
Comparison table: visual vs. verbal IQ items
| Item format | Purpose | Strengths | Weaknesses | Typical uses |
|---|---|---|---|---|
| Visual / diagrammatic (e.g., matrices, block design, figure weights) | Elicit abstract reasoning with minimal reading; probe fluid reasoning and visuospatial processing | Lower language dependence; often objective scoring; wide difficulty scaling; good fit for computerized delivery | Not truly culture-free; can be impacted by vision/motor constraints; may underrepresent language-based skills | Cross-language assessment contexts; fluid reasoning indices; research “background ability” measures |
| Verbal (e.g., vocabulary, similarities, comprehension) | Assess crystallized knowledge, verbal concept formation, learned language-mediated reasoning | Strong links to educational experience; informative for language-based learning profiles; often predictive in school contexts | More sensitive to language background and schooling; translation/adaptation harder; cultural content can intrude | Educational/clinical profiles where language abilities matter; differential diagnosis; comprehensive IQ composites |
Visual IQ item types with worked examples
Before the examples: many real test items are copyrighted and protected (and good tests also guard item security). So the worked problems below are original “toy” examples that mimic common formats without reproducing any proprietary content. The goal is to show how these items work, not to leak anyone’s test booklet.
Two open-license visual examples you can look at (with licenses):
-
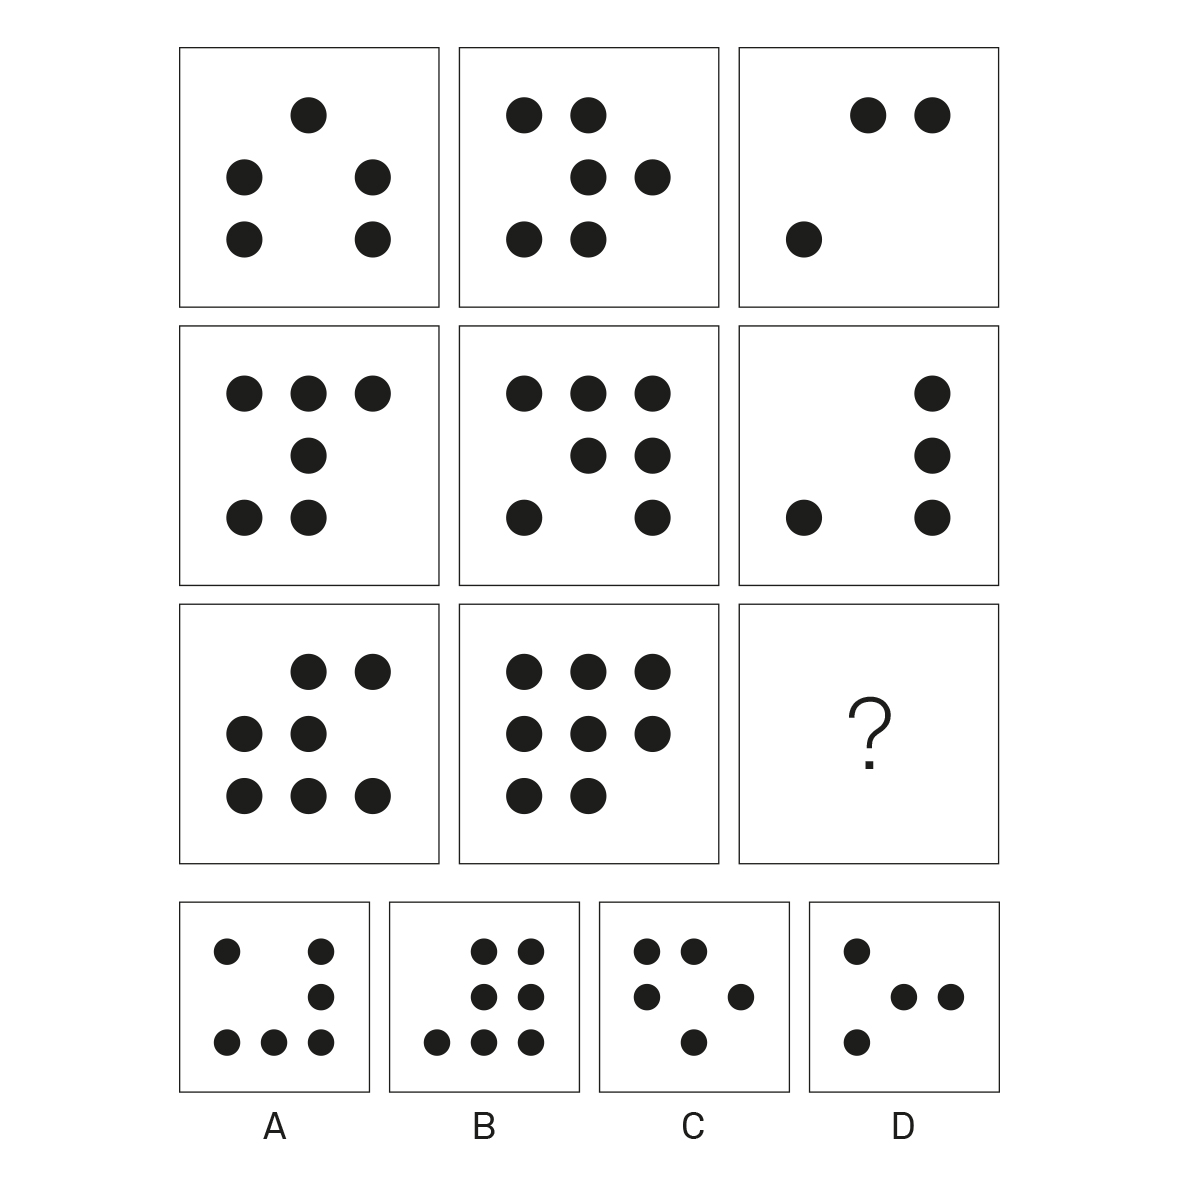
Raven-style progressive matrix example (public domain dedication, CC0): a single missing-cell matrix puzzle in the classic style.
-
Kohs Block Design Test chart (public domain, published before 1931 in the U.S.): a page of designs intended for reproduction with colored blocks.
Now, the common item types and what they’re “really asking.”
Matrix completion (Raven-style)
What it targets: rule induction, relational integration, working-memory control.
Original example
Complete the 3×3 matrix. Each row follows the same rule.
Row 1: ● ●● ●●●
Row 2: ▲ ▲▲ ▲▲▲
Row 3: ■ ?? ■■■
Choices:
A) ■■
B) ■■■■
C) ■
D) ▲▲
Step-by-step solution
-
Notice the pattern across columns in Row 1: one symbol, then two, then three.
-
Row 2 repeats the rule with a different symbol: ▲, ▲▲, ▲▲▲.
-
Row 3 must do the same with ■: ■, ■■, ■■■.
-
So the missing cell is ■■ → Choice A.
Figure weights / balance (visual analogies for algebra)
What it targets: relational reasoning under constraints; often treated as a fluid reasoning indicator.
Original example
A balance scale is level:
Left pan: ★ + ★ + ●
Right pan: ★ + ▲
Question: Which single shape equals ● ?
Choices:
A) ▲
B) ★
C) ★ + ▲
D) (▲ − ★) (conceptually: one ▲ without one ★)
Step-by-step solution
-
Start from equality: ★ + ★ + ● = ★ + ▲
-
Subtract ★ from both sides: ★ + ● = ▲
-
Subtract ★ from both sides: ● = ▲ − ★
-
That corresponds to Choice D (expressed conceptually).
Block design / pattern construction
What it targets: visuospatial analysis, part–whole construction, and (often) speeded performance. Historically, it was explicitly framed as a language-minimized performance test.
Original example (text-only “construction” version)
You have four square tiles. Each tile is either:
-
one solid white square (W), or
-
a diagonal half-black / half-white square (B/W).
Target 2×2 pattern (top view):
[ / ] [ \ ]
[ \ ] [ / ]
Where “/” means black triangle on the bottom-left, and “\” means black triangle on the bottom-right.
Step-by-step solution
-
The target creates an “X” of black triangles meeting in the center.
-
That requires four diagonal tiles, not any solid-white tiles.
-
Two tiles must be oriented “/” and two must be oriented “\”.
-
Place them so the black halves touch in the middle, forming the central X.
Even in this simplified form, you can see why a designer likes block tasks: the instruction can be demonstrated; the outcome is unambiguous; and difficulty scales naturally by increasing block counts and rotations.
Picture completion / missing detail
What it targets: visual attention to essential details and recognition of anomalies—useful in some clinical profiles, but also culturally loaded (what “should” be in a scene?). Army Beta included pictorial completion taught via demonstration.
Original example
A drawing shows a bicycle with two wheels, pedals, a seat… and no chain.
Question: What’s missing?
Step-by-step:
-
Identify the object (bicycle).
-
Ask what’s required for function (power transfer).
-
Spot the absent functional part (chain) → answer.
Mental rotation / spatial transformation
What it targets: manipulating representations, checking invariants under rotation/reflection—skills related to visuospatial reasoning.
Original example
Shape: an L made of 3 squares:
■
■
■■
Which option is the same shape rotated (not mirrored)?
A) ■■
■
■
B) ■
■
■■ (mirror)
C) ■■■ (different)
■
D) ■■
■■ (different)
Step-by-step
-
List invariants: 3 squares in a vertical line with 2 attached at the bottom (an “L”).
-
Rotation keeps adjacency; mirroring flips handedness.
-
Option A is the same adjacency rotated 90°.
-
Option B reverses handedness (mirror), so not allowed.
-
Answer: A.
Criticisms, limitations, and implications for education and test-takers
Visual-heavy IQ tests are useful—but they are not a neutral window into “pure intelligence.”
Nonverbal is not culture-free
Even when tests minimize language, they still rely on learned conventions: interpreting 2D diagrams, understanding that abstract tokens stand for rules, and knowing how timed multiple-choice testing works. That is why professional guidance treats cross-cultural use and adaptation as a structured validation process, not a branding claim.
DIF studies underscore the same point: item-level bias and structural equivalence must be checked empirically, including for nonverbal measures.
Practice and retest effects are real
When people repeat cognitive ability tests, scores often improve due to familiarity, strategy learning, and reduced novelty. Meta-analytic work documents practice/retest effects across cognitive ability measures.
This interacts with visual puzzle formats in a very modern way: widely circulated “IQ puzzle” content online can increase prior exposure, and narrow item banks raise repeat-exposure concerns—one motivation for building larger open item banks and parallel forms.
Even the Standards highlight a technical caution: when the same form is reused, test–retest correlations can be inflated by memory for initial responses.
Accessibility and construct-irrelevant variance
A visually dense test can inadvertently measure eyesight quality, speeded scanning, or fine-motor efficiency—especially under time limits—adding construct-irrelevant variance if the intended interpretation is “reasoning.” The Standards explicitly discuss how accommodations or altered materials may change reliability/precision and therefore should be evaluated, not assumed harmless.
Education implications: what gets measured shapes what gets emphasized
Visual reasoning subtests can be informative for educational planning, but they are not interchangeable with verbal abilities. A longitudinal study comparing different intelligence tests found that a primarily nonverbal test predicted mathematics grades but was not a predictor of language grades in the same way that more verbally loaded batteries were—consistent with the idea that test composition matters for what outcomes you can reasonably predict.
For educators, the practical takeaway is not “ban visual tests,” but “interpret them as part of a profile.” The Standards’ framing of validity as use-dependent is crucial here: a score that is useful for one decision may be weak evidence for another.
Test-taker implications: how to read (and not over-read) a score
If you’re taking an IQ test (for assessment, placement, or research), visual items reward:
-
slow-and-steady rule checking (avoid jumping at the “pretty” answer),
-
external strategy (systematically list likely rules),
-
and managing time so one hard item doesn’t consume the whole section.
But it’s also fair to recognize what they don’t fully capture. A battery that leans too hard on visual puzzles may underrepresent language-mediated reasoning, domain knowledge, and real-world problem solving—traits that are strongly shaped by education and experience.
Conclusion and further reading
Visual/diagrammatic items dominate many IQ testing contexts because they solved an early practical problem (mass assessment across language and literacy differences) and then proved psychometrically convenient: objective scoring, scalable difficulty, and strong alignment with fluid reasoning constructs. They also map cleanly onto cognitive mechanisms—working memory, executive attention, and relational integration—supported by distributed brain networks rather than by language alone.
At the same time, visual-heavy testing is not automatically fair, complete, or immune to coaching and retest effects. The best interpretation is always conditional: What was the score used for, what evidence supports that use, and what might the format be inadvertently measuring?
Suggested further reading (primary/official + academic):
-
The Development of Intelligence in Children (Binet and Simon 1916 translation).
-
Psychological Examining in the United States Army (Yerkes 1921 report).
-
Army Mental Tests (Yoakum and Yerkes 1920).
-
The Measurement of Adult Intelligence (Wechsler 1939 book).
-
Standards for Educational and Psychological Testing (2014 edition).
-
ITC Guidelines for Translating and Adapting Tests (second edition v2.4).
-
Carpenter, Just, & Shell (1990) theoretical account of Raven matrices processing.
-
Jung & Haier (2007) P-FIT model (neuroimaging synthesis on intelligence networks).
-
Engle & Kane (2004) on executive attention/working memory capacity and higher-order cognition.
-
Deary, Penke, & Johnson (2010) review on neuroscience correlates of intelligence differences.
-
Open-access item development: MaRs-IB and modern IRT validation work (useful for seeing how visual items are engineered today).
Related Articles
Why Intelligent People Love Logic Puzzles
March 8, 2026

Signs You May Be Smarter Than Average
March 8, 2026


Comments